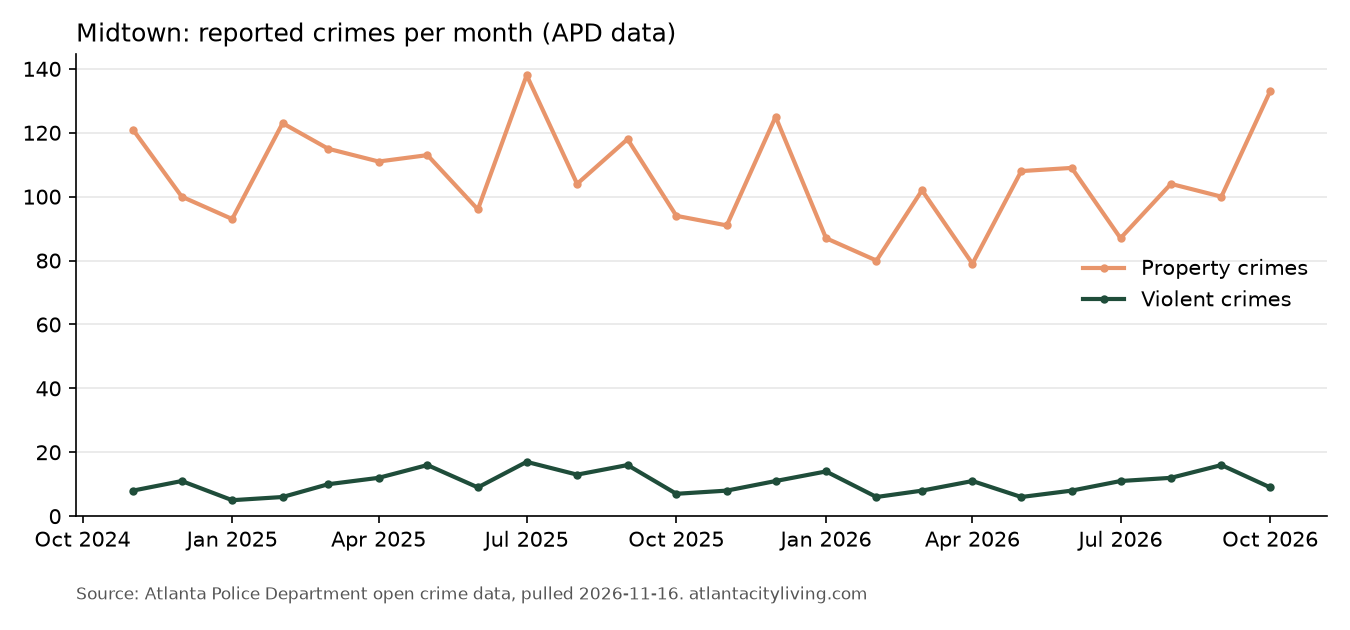
Atlanta Police recorded 120 violent crimes and 1,205 property crimes in Midtown from November 2025 through October 2026. Violent crime was down 8% compared with the previous 12 months, and property crime was down 9%. Across Atlanta, violent crime was up 12%. Property crime accounts for 91% of the violent and property crimes reported in Midtown, and theft from vehicles is the most common property crime, with 486 reports.
This page uses only official Atlanta Police Department (APD) data. Updated monthly; data pulled November 16, 2026.
Midtown crime at a glance
Violent crimes
120
▼ 8% vs prior 12 mo.
Midtown, last 12 months
Property crimes
1,205
▼ 9% vs prior 12 mo.
Midtown, last 12 months
Theft from vehicles
486
▼ 17% vs prior 12 mo.
Most common property crime
Atlanta violent crimes
3,507
▲ 12% vs prior 12 mo.
Citywide, same 12 months
Last 12 months = November 2025 through October 2026. Prior 12 months = November 2024 through October 2025.
| Category | Last 12 mo. | Prior 12 mo. | Change | Share of city |
|---|---|---|---|---|
| Violent crime | 120 | 130 | ▼ 8% | 3.4% |
| Property crime | 1,205 | 1,326 | ▼ 9% | 8.0% |
| Other reported offenses | 1,739 | 1,925 | ▼ 10% | 5.2% |
| All reported offenses | 3,064 | 3,381 | ▼ 9% | 5.9% |
Crime by type
Violent crime
| Offense | Last 12 mo. | Prior 12 mo. | Change |
|---|---|---|---|
| Aggravated assault | 86 | 92 | ▼ 7% |
| Robbery | 27 | 30 | ▼ 10% |
| Rape | 5 | 5 | small numbers |
| Murder and nonnegligent manslaughter | 2 | 3 | small numbers |
Property crime
| Offense | Last 12 mo. | Prior 12 mo. | Change |
|---|---|---|---|
| Theft from vehicles | 486 | 589 | ▼ 17% |
| Other theft (larceny) | 333 | 348 | ▼ 4% |
| Vehicle theft | 189 | 187 | ▲ 1% |
| Shoplifting | 131 | 105 | ▲ 25% |
| Burglary | 64 | 96 | ▼ 33% |
| Arson | 2 | 1 | small numbers |
Most common other offenses
| Offense | Last 12 mo. | Prior 12 mo. | Change |
|---|---|---|---|
| All other offenses (disorderly conduct, trespass, DUI and similar) | 729 | 930 | ▼ 22% |
| Vandalism and property damage | 296 | 277 | ▲ 7% |
| Simple assault and intimidation | 274 | 201 | ▲ 36% |
| Fraud | 265 | 302 | ▼ 12% |
| Drug offenses | 130 | 165 | ▼ 21% |
| Other sex offenses | 19 | 9 | small numbers |
| Counterfeiting/Forgery | 9 | 11 | small numbers |
| Extortion/Blackmail | 4 | 1 | small numbers |
Where reported crimes happened
APD records a location type for each offense. In Midtown over the last 12 months:
- Parking lots and garages: 699 (23% of all offenses)
- Streets and sidewalks: 686 (22% of all offenses)
- Apartments: 363 (12% of all offenses)
- Houses: 270 (9% of all offenses)
- Restaurants: 143 (5% of all offenses)
Of the 120 violent crimes, 68 (57%) had a recorded start time between 8 p.m. and 6 a.m.
How Midtown compares
Across the whole city, APD recorded 3,507 violent crimes (up 12% from 3,121) and 14,997 property crimes (down 19% from 18,414) over the same 12 months. Midtown accounted for 3.4% of the city’s violent crime and 8.0% of its property crime.
| Area | Violent, last 12 mo. | Property, last 12 mo. |
|---|---|---|
| Midtown | 120 | 1,205 |
| Downtown | 298 | 1,084 |
| Old Fourth Ward | 88 | 462 |
We do not publish a per-resident crime rate for Midtown. There is no official population count for this exact boundary, and rates based on residents can mislead in areas where many more people work and visit than live.
Why other Midtown crime numbers you see may differ
Midtown Alliance, which runs the Midtown Improvement District, also publishes crime figures from APD reports. Its numbers cover the district’s 1.2 square miles, a different boundary than the city’s official Midtown neighborhood used on this page. For calendar year 2025 it reported 709 total crimes in the district, down 10% from 790 in 2024 (Midtown Alliance year-end 2025 report). The same report estimates that more than 100,000 workers, residents and visitors spend time in Midtown on an average day, which helps explain why a dense business district records more incidents than a mostly residential neighborhood.
What this data does not capture
- Crimes that were never reported to police are not included.
- Counts show where crimes were reported, not where victims or suspects live. Busy commercial areas with many visitors tend to record more incidents.
- Incidents handled only by other agencies, such as campus or transit police, may not appear in APD’s data.
- About 8% of APD records have no neighborhood assigned. They count toward the Atlanta totals but not toward any neighborhood.
- Recent months can change as APD updates or reclassifies reports.
- One police report can include more than one offense. This page counts offenses.
A practical note
Thefts from vehicles are the most common property crime reported in Midtown. Keeping bags, electronics and other valuables out of sight in a parked car, or taking them with you, addresses the most frequent type of property crime here.
Methodology and sources
Source: Atlanta Police Department Open Data (offense-level crime records, the same data behind APD’s Neighborhood Crime Map). Pulled November 16, 2026.
- Area: APD’s neighborhood field, which follows the City of Atlanta’s official Midtown neighborhood boundary.
- Time periods: offenses by report date, November 2025 through October 2026 compared with November 2024 through October 2025, Eastern time.
- Violent crime: murder and nonnegligent manslaughter, rape, robbery and aggravated assault (FBI definition).
- Property crime: burglary, larceny-theft (including theft from vehicles and shoplifting), motor vehicle theft and arson (FBI definition).
- Other reported offenses: everything else APD records, such as simple assault, vandalism, fraud and drug offenses. Records APD marks as not a crime are excluded.
- Totals here will not exactly match FBI or APD annual reports, which use different counting rules and calendar years.
More about Midtown
Frequently asked questions
Is Midtown safe to live in?
Atlanta Police recorded 120 violent crimes and 1,205 property crimes in Midtown from November 2025 through October 2026. Violent crime was down 8% compared with the previous 12 months, and property crime was down 9%. Across Atlanta, violent crime was up 12%. Property crime accounts for 91% of the violent and property crimes reported in Midtown, and theft from vehicles is the most common property crime, with 486 reports.
What is the most common crime in Midtown?
Theft from vehicles is the most common property crime. APD recorded 486 from November 2025 through October 2026, out of 1,205 property crimes and 120 violent crimes.
Is crime in Midtown going up or down?
From November 2025 through October 2026, violent crime in Midtown went from 130 to 120 and property crime from 1,326 to 1,205, compared with the previous 12 months.
Is Midtown safe at night?
APD data does not measure safety directly. Of the 120 violent crimes recorded in Midtown from November 2025 through October 2026, 68 had a start time between 8 p.m. and 6 a.m.
Is Midtown safer than Downtown?
From November 2025 through October 2026, APD recorded 120 violent crimes in Midtown and 298 in Downtown, and 1,205 versus 1,084 property crimes. These are raw counts and do not adjust for differences in area, residents or visitors.
Where does this data come from?
All figures come from the Atlanta Police Department's open crime data, pulled November 16, 2026. We update this page monthly.