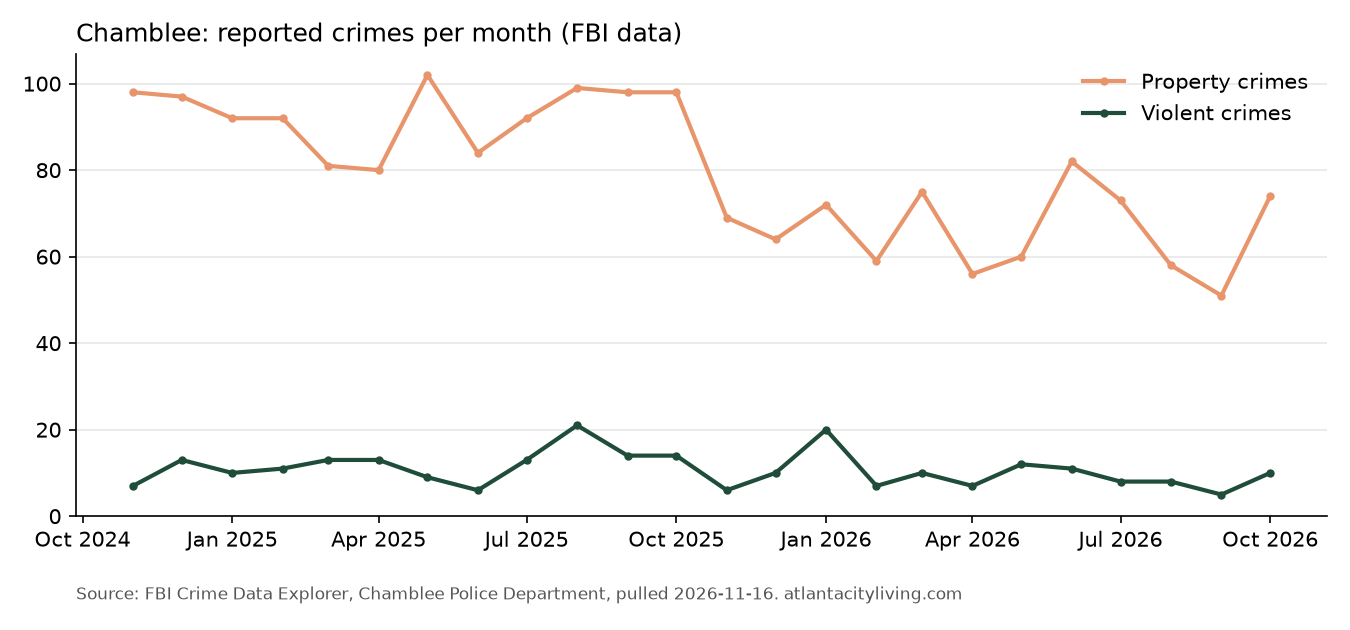
The Chamblee Police Department reported 114 violent crimes and 793 property crimes to the FBI from November 2025 through October 2026, the latest 12 months available. Violent crime was down 21% compared with the previous 12 months, and property crime was down 29%. Larceny-theft is the most common property crime, with 655 reports.
These figures cover the whole City of Chamblee as policed by the Chamblee Police Department. The department does not publish neighborhood-level data, so this page is citywide. The latest month available from the FBI is October 2026. Data pulled November 16, 2026.
Chamblee crime at a glance
Violent crimes
114
▼ 21% vs prior 12 mo.
City of Chamblee, last 12 months
Property crimes
793
▼ 29% vs prior 12 mo.
City of Chamblee, last 12 months
Larceny-theft
655
▼ 23% vs prior 12 mo.
Most common property crime
Last 12 months = November 2025 through October 2026. Prior 12 months = November 2024 through October 2025.
| Category | Last 12 mo. | Prior 12 mo. | Change |
|---|---|---|---|
| Violent crime | 114 | 144 | ▼ 21% |
| Property crime | 793 | 1,113 | ▼ 29% |
| Violent and property crime | 907 | 1,257 | ▼ 28% |
Crime by type
Violent crime
| Offense | Last 12 mo. | Prior 12 mo. | Change |
|---|---|---|---|
| Aggravated assault | 78 | 97 | ▼ 20% |
| Robbery | 26 | 35 | ▼ 26% |
| Rape | 10 | 8 | small numbers |
| Murder and nonnegligent manslaughter | 0 | 4 | small numbers |
Property crime
| Offense | Last 12 mo. | Prior 12 mo. | Change |
|---|---|---|---|
| Larceny-theft | 655 | 851 | ▼ 23% |
| Motor vehicle theft | 67 | 117 | ▼ 43% |
| Burglary | 64 | 141 | ▼ 55% |
| Arson | 7 | 4 | small numbers |
What this data does not capture
- Crimes that were never reported to police are not included.
- Only crimes handled by the Chamblee Police Department are counted. Incidents handled by county, state, school or transit police may not appear.
- There is no neighborhood breakdown. Conditions vary from street to street within the city.
- Recent months can change as the department updates its FBI submissions.
Methodology and sources
Source: FBI Crime Data Explorer, monthly offense counts for the Chamblee Police Department (agency ORI GA0440400). Pulled November 16, 2026.
- Time periods: the latest 12 reported months, November 2025 through October 2026, compared with November 2024 through October 2025.
- Violent crime: murder and nonnegligent manslaughter, rape, robbery and aggravated assault (FBI definition).
- Property crime: burglary, larceny-theft, motor vehicle theft and arson (FBI definition).
- Per-resident rates for Chamblee and other nearby cities are in our Safest Neighborhoods in Atlanta guide, using Census city population estimates. They are not directly comparable to Atlanta neighborhood rates.
More about Chamblee
Frequently asked questions
Is Chamblee safe to live in?
The Chamblee Police Department reported 114 violent crimes and 793 property crimes to the FBI from November 2025 through October 2026, the latest 12 months available. Violent crime was down 21% compared with the previous 12 months, and property crime was down 29%. Larceny-theft is the most common property crime, with 655 reports.
What is the most common crime in Chamblee?
Larceny-theft is the most common property crime. The Chamblee Police Department reported 655 from November 2025 through October 2026, out of 793 property crimes and 114 violent crimes.
Is crime in Chamblee going up or down?
From November 2025 through October 2026, violent crime went from 144 to 114 and property crime from 1,113 to 793, compared with the previous 12 months.
Does this data cover Chamblee neighborhoods?
No. The Chamblee Police Department reports citywide totals to the FBI, so this page covers the whole city. The latest month available is October 2026.
Where does this data come from?
All figures come from the FBI Crime Data Explorer, pulled November 16, 2026. We update this page monthly.